Motion Lab
Purpose: The purpose of this lab is to create a Position vs. Time Graph, gain competence in the use of the motion detector and related equipment, and understand the relationship between position vs. time, velocity and acceleration.
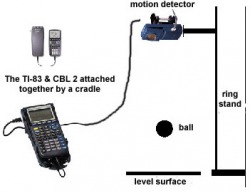
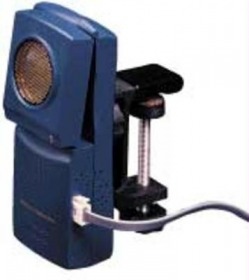
Equiptment: TI-84 Calculator-Based Lab Unit (CBL-II), Motion detector, Meter stick, Computer with LoggerPro software. Below are pictures of the motion detector.
Purpose: The purpose of this lab is to create a Position vs. Time Graph, gain competence in the use of the motion detector and related equipment, and understand the relationship between position vs. time, velocity and acceleration.
Equiptment: TI-84 Calculator-Based Lab Unit (CBL-II), Motion detector, Meter stick, Computer with LoggerPro software. Below are pictures of the motion detector.
Procedure: 1. Develop a position vs. time story that describes a body in motion incorporating at least the following four types of motion: standing still, moving with constant velocity, moving with variable negative velocity, moving with variable positive velocity.
2. Illustrate the story on a position vs. time graph. Use a legend to cross reference sections of the graph with the corresponding sections of the story.
3. Underneath the graph, write instructions for another lab group to move according to the graph you have drawn.
Data/Analysis:
Tamara’s Adventure
1. Tamara arrives at the park and begins her refreshing morning run and travels 1.5 miles before realizing that she is lost.
2. Then she begins to jog in the opposite direction for 1.2 miles
3. Then, Tamara become tired and must stop and rest for 25 minutes.
4. Tamara soon encounters a dog that proceeds to chase her for .5 miles.
5. To try to lose the dog, Tamara changes direction and runs at varying speeds for another 1.5 miles before the dog loses interest and goes away. Tamara has a long walk home.
Instructions: Stand in front of the motion detector. Move forward for 1.5 seconds at a constant pace. Move backwards for 0.75 seconds at the same pace. Stop for 1.5 seconds. Move backwards for 0.5 seconds at the same pace as the beginning. Finally, run the remainder of the time towards the motion detector at varying speeds.
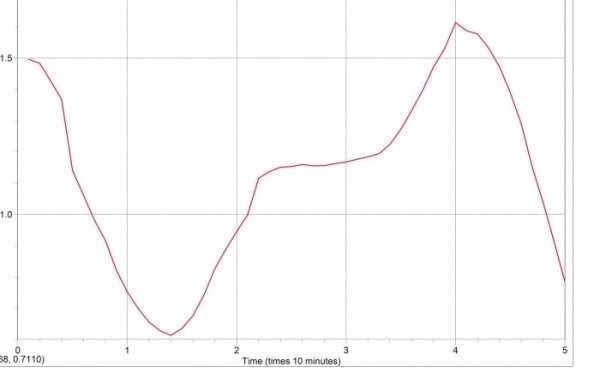
*Note: On graph, y-axis is not pictured. It is supposed to be the distance, measured in miles.
Conclusion: The Position vs. Time Graph taught much about how postion, time, acceleration, and velocity. While using the motion detector, it was hard to recreate our original graph exactly because the motion detector is so precise. There was error in our LoggerPro graph because no person will be able to stay perfectly still, change directions in time, or keep speed constant enough to perfectly match our original graph.
Conclusion: The Position vs. Time Graph taught much about how postion, time, acceleration, and velocity. While using the motion detector, it was hard to recreate our original graph exactly because the motion detector is so precise. There was error in our LoggerPro graph because no person will be able to stay perfectly still, change directions in time, or keep speed constant enough to perfectly match our original graph.
