Purpose:
Your challenge is to design an experiment that will establish the relationship between centripetal force, radius, and angular velocity. Decide what data should be collected and graphed in order to assist in your development of a mathematical model to describe the relationship.
Equipment:
-Stop watch
-Hollow tube
-Nylon string
-Rubber stopper
-Steel washers
-Meter stick
-Hollow tube
-Nylon string
-Rubber stopper
-Steel washers
-Meter stick
Factors to Consider:
- What data should you collect ? We should record the weight of each end of our mechanism and the radius before any testing. While experiment we should record the time of ten revolutions in many different trials.
- Which variables should be graphed in order to establish the mathematical model? Force versus time.
- After graphing the variables, how will you establish a relationship? We will look for the best fit curve for the points given. Some points may need to be taken out due to human error.
- How will you test the validity of your mathematical model? In the computer graphing program that we have, we are able to set a curve through the points to make sure that the data we found was accurate.
Procedure:
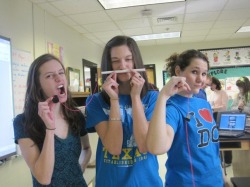
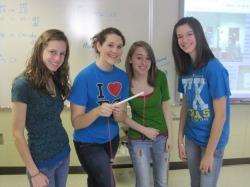
We constructed an object out of the given equipment. This object was a string with weight on both ends. The hollow tube was used in the middle of the string so when someone spun the device, his or her hand would not touch the string. One end of the string was a rubber stopper tied with a bowline knot. The other side was ten steel washers. We massed both sides prior to experimentation. Our experiment was to spin the washers in the air horizontally while keeping the radius 50 cm. We did this by marking the string at the bottom and spinning at the correct velocity. The video below, although not horizontal, shows one trial of our experimentation.
Data:
Stopper: 20.1 g
Weights and Mini Stopper: 32.3g
Radius: 50 cm
Failed Revolutions (Too low)
-8.40 s
-8.282 s
Horizontal Revolutions
-7.2 s
-7.3 s
-7.78 s
Weights and Mini Stopper: 32.3g
Radius: 50 cm
Failed Revolutions (Too low)
-8.40 s
-8.282 s
Horizontal Revolutions
-7.2 s
-7.3 s
-7.78 s
Mass(kg) Force(N) Time/Rev(s) W(rad/s) v(m/s)
0.0212 0.208 0.5998 10.4755 5.23775
0.0323 0.3165 0.743 8.456 4.228
0.06285 0.61593 0.5263 11.9384 5.9692
0.044 0.4314 0.6011 10.4528 5.2264
0.056 0.5488 0.5053 11.4129 5.70645
0.0212 0.208 0.5998 10.4755 5.23775
0.0323 0.3165 0.743 8.456 4.228
0.06285 0.61593 0.5263 11.9384 5.9692
0.044 0.4314 0.6011 10.4528 5.2264
0.056 0.5488 0.5053 11.4129 5.70645
Data Analysis:
| fvv.doc |
The graph above is the Force v. Velocity graph with the points from our collected data and the best fit quadratic curve.
We took the force and velocity from 5 different trials and plotted it on a graph. Once two points were removed because they most likely had error, the best fit curve was found. That line was quadratic with little error.
We took the force and velocity from 5 different trials and plotted it on a graph. Once two points were removed because they most likely had error, the best fit curve was found. That line was quadratic with little error.
Conclusion:
No one could perfectly keep a radius of 50 cm and when spinning the weights, it was never perfectly horizontal. The errors from this mattered for some groups and others, it was negligable. This required some groups to do the experiment multiple times. After trial and error, we came to the conclusion that there is a quadratic relationship between force and centripetal velocity!


